According to the fund house – SBI Contra Fund aims to provide investors with opportunities for long-term capital appreciation through an active management of investments following a contrarian investment strategy.
Whatever the actual strategy, the scheme has shown substantial outperformance in recent times. The performance comparison is impressive, as can be seen in the table below.

So, what is curious about this? That part comes about if one evaluates the consistency of this impressive performance. In other words, has the scheme always outperformed the Sensex?
We did some analysis to figure that out.
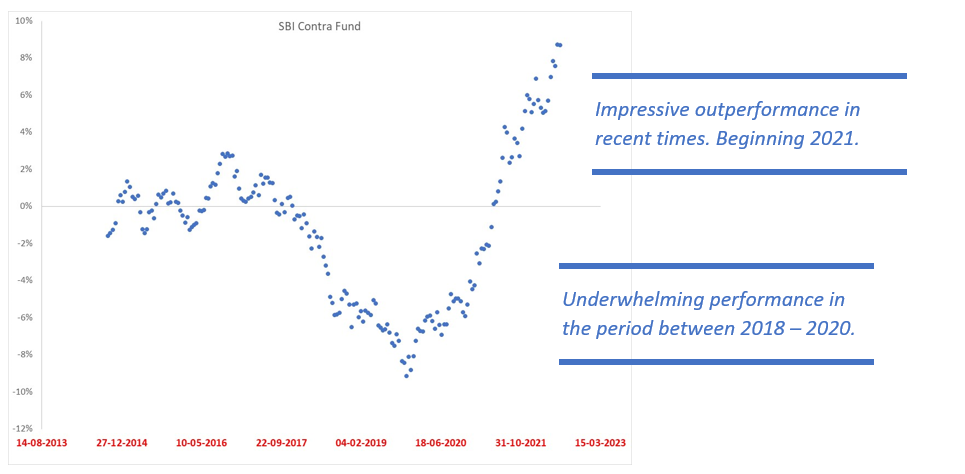
Consider the performance of the scheme on a rolling 3-year window – to make it simpler, we took 3-year windows starting every fortnight, and calculated the returns for each window. Then we compared the returns against the NIFTY 500 TRI (these are very similar to the Sensex returns). It throws up an interesting scenario from an investors perspective.
The below chart shows the outperformance of the fund vs. NIFTY 500 for each 3-year window.

Wonder what could cause such a big difference in performance over time! The Investopedia definition of Contrarian Investing – “an investing strategy that looks for profit opportunities in trades that go against current market sentiment.”
- Is it the fund philosophy/ strategy? Does a contrarian investment strategy necessarily produce prolonged periods of underperformance?
- Could it be that the execution of fund strategy faltered? Very difficult to judge this.
Contrarian investing will usually have periods where the portfolio underperforms. It could take a significant amount of time before an undervalued (or underappreciated) stock begins to gain. In such a scenario, would you be comfortable investing into, and holding, the fund? Would this become a part of your MF portfolio? Interesting questions to ponder over, and please note that there is no guarantee of outperformance in the future.
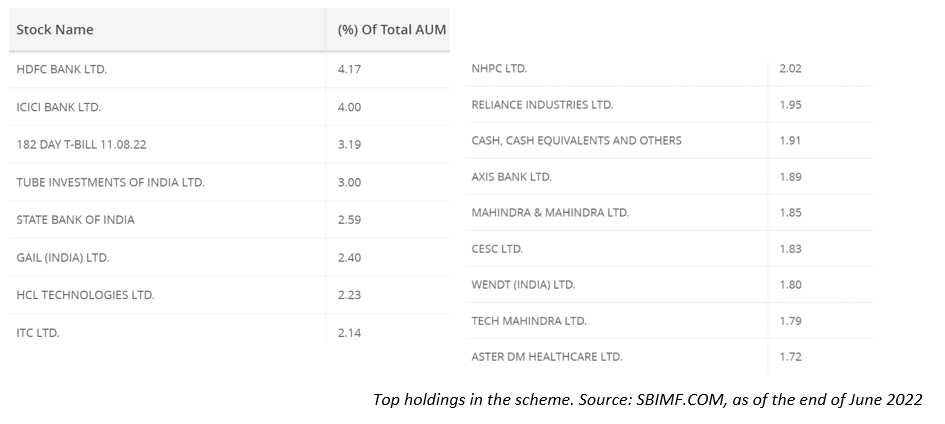
Apart from the performance, the portfolio of the fund makes for an interesting read too.

We do not have the data on when each of these positions were taken. But it would be interesting to see which of these stocks are truly contrarian positions.
Your comments are welcome

